
A beginner-to-pro guide to reading the numbers before you buy.
Picking a winning stock is not about luck, hot tips, or following the loudest voice on social media. It is about understanding the business behind the ticker symbol.
Fundamental analysis is the skill that separates long-term investors from gamblers. It helps you answer one simple question: Is this company actually worth my money?
In this guide, we will break down how to read a balance sheet, analyse quarterly results, screen stocks like a pro, and avoid the mistakes that trap most beginners. By the end, you will have a clear, repeatable process you can use before buying any stock.
Let's get started.
What Is Fundamental Analysis (In Plain English)?
Fundamental analysis is the method of measuring a stock's real, or “intrinsic,” value by studying the company's financial health, business model, management, and growth prospects.
Think of it like buying a used car. You would not pay based on the shiny paint alone. You would check the engine, the service history, and the mileage. Fundamental analysis is that inspection — but for a business.
There are two broad approaches investors use:
- Top-down — Start with the big picture (economy, then sector, then company).
- Bottom-up — Start with the individual company and its numbers first.
Beginners usually do best with a blend of both. Understand the industry the company operates in, then dig into the specific business.
How to Read a Company's Balance Sheet
The balance sheet is a snapshot of what a company owns and what it owes on a specific date. It follows one golden equation:
Assets = Liabilities + Shareholders' Equity
If a company's assets are growing faster than its liabilities year after year, that is usually a healthy sign. Here is how to read the three main parts.
1. Assets (what the company owns)
- Current assets — cash, inventory, and money customers owe (receivables). These can be converted to cash within a year.
- Non-current assets — factories, machinery, land, and long-term investments.
2. Liabilities (what the company owes)
- Current liabilities — short-term debts and bills due within a year.
- Non-current liabilities — long-term loans and bonds.
3. Shareholders' Equity (what belongs to owners)
This is what remains after you subtract liabilities from assets. Growing equity over time is a strong positive.
| Ratio | What it tells you | Healthy signal |
|---|---|---|
| Debt-to-Equity | How much the company borrows vs. owns | Lower is safer (below 1 is often ideal) |
| Current Ratio | Ability to pay short-term bills | Above 1.5 is comfortable |
| Return on Equity (ROE) | Profit generated per rupee of equity | 15%+ is attractive |
A quick habit: never look at one number in isolation. A low debt figure means little if profits are shrinking. Always read the numbers together.
How to Analyse Quarterly Results Before Buying a Stock
Every listed company reports its performance every three months. These quarterly results are your window into whether a business is improving or slowing down.
Do not just react to the headline “profit up” or “profit down.” Dig one level deeper.
Here is a simple checklist to run through every quarter:
- Revenue growth — Is the company selling more than the same quarter last year (YoY) and last quarter (QoQ)?
- Net profit — Is profit growing, and is it growing faster than revenue? That signals improving efficiency.
- Operating margins — Rising margins mean the company keeps more of each rupee it earns.
- Debt levels — Is borrowing rising or falling compared to previous quarters?
- Management commentary — The concall and investor notes often reveal future plans, risks, and demand trends.
One-time vs. recurring profit
A company might post a huge profit because it sold a building — that is a one-time gain, not real business growth. Always separate operating profit (from the core business) from one-off items.
A quick comparison table
| Signal | Bullish (Good) | Bearish (Warning) |
|---|---|---|
| Revenue | Growing YoY and QoQ | Flat or declining |
| Margins | Expanding | Shrinking |
| Debt | Reducing | Rising sharply |
| Guidance | Confident, clear | Vague, defensive |
Best Stock Selection Strategies for Beginners
If you are just starting out, keep it simple. You do not need twenty ratios. You need a handful of solid principles applied consistently.
Here are strategies that work well for beginners:
- Buy what you understand. If you cannot explain how a company makes money in one sentence, skip it.
- Prefer profitable, established companies first. Learn on stable businesses before touching risky small-caps.
- Look for consistent earnings. A company that has grown profits steadily for 5+ years is more reliable than one with a single lucky year.
- Check the debt. Heavy debt can sink even a good business during tough times.
- Think in years, not days. Fundamental analysis rewards patience.
The “quality checklist” for a beginner
Before buying, a stock should ideally tick these boxes:
- Consistent revenue and profit growth
- Low-to-moderate debt
- Strong return on equity (ROE)
- A competitive edge (brand, cost advantage, or market leadership)
- Reasonable valuation (you are not overpaying)
If a company fails three or more of these, it is usually a pass.
Stock Screening Techniques Every Trader Should Learn
You cannot analyse 5,000 stocks by hand. A stock screener does the heavy lifting by filtering the market down to a shortlist that matches your rules.
Think of screening as a funnel: you start with the entire market and, filter by filter, narrow it down to a handful of names worth a closer look. Here is what that funnel looks like.
The screening funnel: each filter removes weak candidates, leaving a short, high-quality list.
Notice how fast the numbers shrink. A couple of sensible filters take you from thousands of stocks to a few dozen, so you spend your time on the best candidates, not the noise.
Step-by-step screening process
- Set your universe. Choose the market or index (for example, large-caps only to start).
- Apply financial filters. For example: market cap above a chosen level, debt-to-equity below 1, ROE above 15%, and positive profit growth over 3–5 years.
- Add valuation filters. Such as a reasonable P/E ratio compared to industry peers.
- Review the shortlist manually. Screeners give you candidates, not conclusions. Read each company's story before deciding.
Common screening filters explained
| Filter | Meaning | Why it Matters |
|---|---|---|
| P/E Ratio | Price paid per rupee of earnings | Spots over- or under-valued stocks |
| Market Cap | Total company size | Helps manage risk (large vs. small) |
| Dividend Yield | Annual dividend vs. price | Useful for income-focused investors |
| Debt-to-Equity | Borrowing vs. ownership | Flags financial risk |
What a screener actually looks like
When you run those filters, your screener spits out a results grid. Each row is a company; each column is a metric. The skill is learning to scan it — your eye should jump to the numbers that pass and the ones that fail. Here is a simplified example.
| Stock | Mkt Cap | P/E | ROE | D/E | 3-yr Rev Growth | Verdict |
|---|---|---|---|---|---|---|
| Alpha Ltd | Large | 18 | 22% | 0.3 | 19% | PASS |
| Bravo Inds | Mid | 14 | 17% | 0.6 | 15% | PASS |
| Delta Corp | Large | 41 | 9% | 1.8 | 6% | FAIL |
| Echo Tech | Mid | 26 | 16% | 0.4 | 24% | PASS |
| Foxtrot Co | Small | 8 | 6% | 2.4 | -2% | FAIL |
Illustrative only — fictional stocks, not investment advice. Green = meets criterion, red = fails.
A simplified screener output. Green cells meet your criteria; red cells break them. Fictional stocks, for illustration only.
Read it the way a screener trains you to: Alpha and Echo clear every hurdle, so they earn a deeper look. Foxtrot's shrinking revenue and heavy debt rule it out — no matter how “cheap” its P/E of 8 looks. A low price with weak fundamentals is a trap, not a bargain.
The goal of screening is not to find “the one perfect stock.” It is to save time and focus your research on the strongest candidates.
How to Spot a Fundamentally Strong Stock at a Glance
Once you have your shortlist, you still need to judge each business. Over time you will train your eye to recognise a fundamentally strong company almost instantly — it tends to share the same handful of traits. Keep this mental checklist handy.
Tick most of these and you likely have a quality business.
The traits that show up again and again in quality businesses.
No single company will be perfect on every line, and that is fine. But when a stock ticks most of these boxes — steady profit growth, high ROE, low debt, healthy margins, a real edge, and a fair price — you are almost certainly looking at a quality business rather than a lottery ticket.
A Real-World Example: Reading TCS (FY22–FY26)
Theory clicks faster with a real company. Let us run Tata Consultancy Services (TCS) through the same lens — fundamentals first, then the price chart. All figures are recent, real data used purely for education, not a recommendation to buy or sell.
Step 1 — The fundamentals
Theory clicks faster with a real company. Let us run Tata Consultancy Services (TCS) through the same lens — fundamentals first, then the price chart. All figures are recent, real data used purely for education, not a recommendation to buy or sell.
Step 1 — The fundamentals
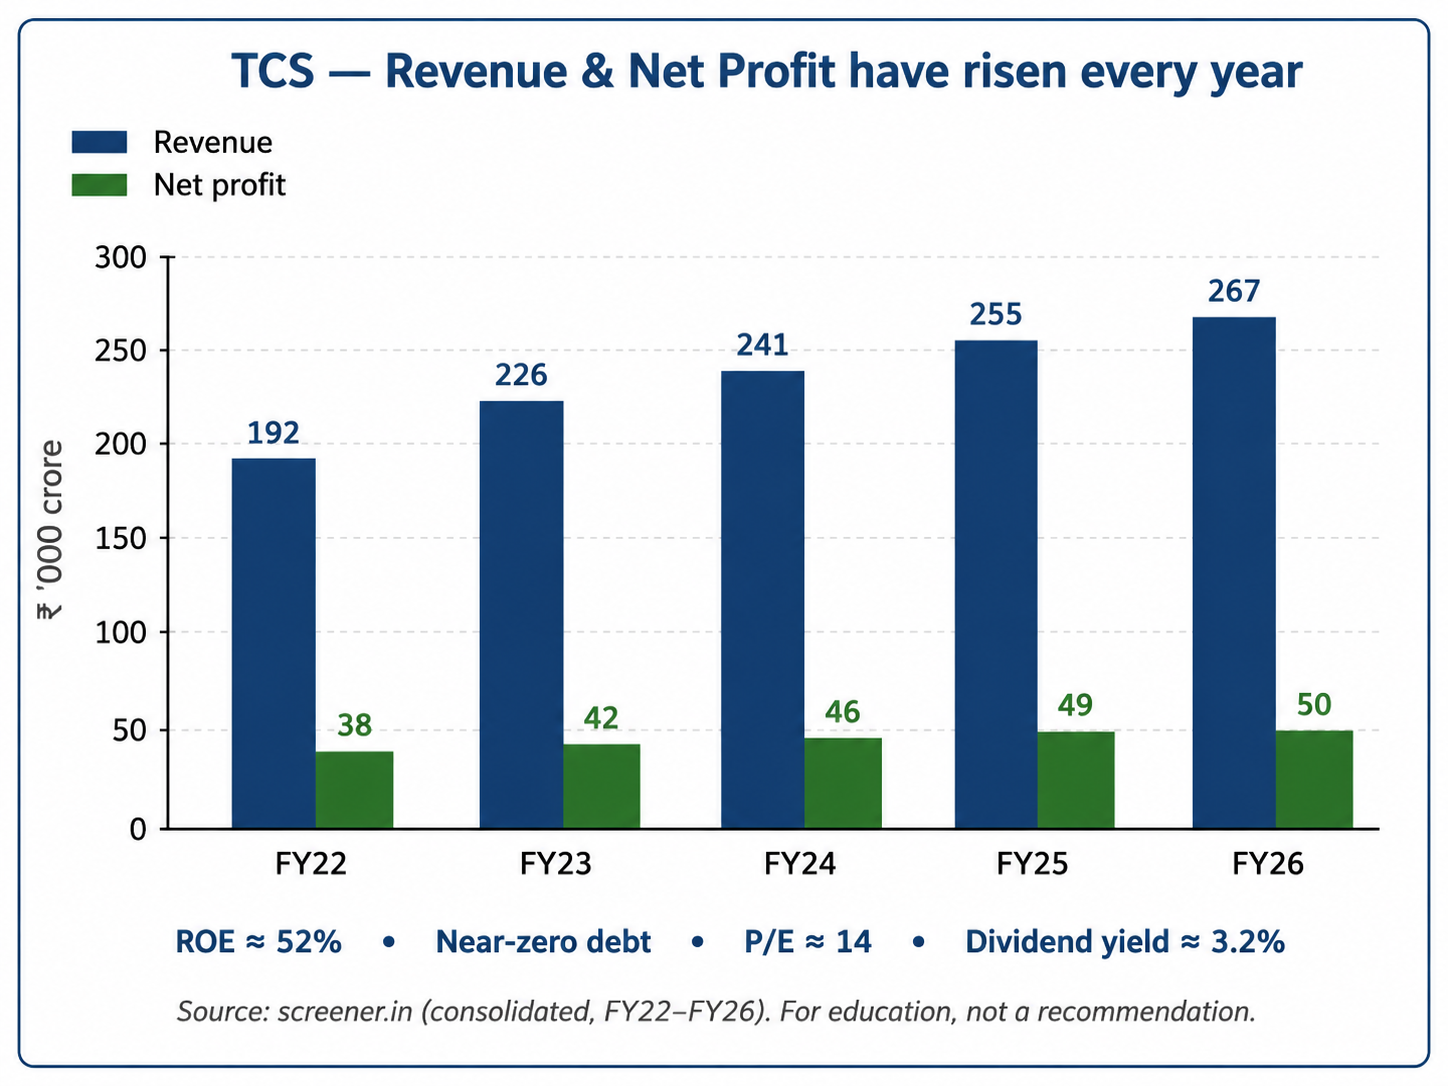
TCS revenue and net profit, FY22–FY26. Source: screener.in (consolidated).
Read the bars from left to right and a clear story emerges:
TCS revenue and net profit, FY22–FY26. Source: screener.in (consolidated).
Read the bars from left to right and a clear story emerges:
- Revenue keeps climbing — from about ₹1.92 lakh crore in FY22 to roughly ₹2.67 lakh crore in FY26. Steady, not spiky.
- Profit rises with it — from ~₹38,000 crore to ~₹49,000 crore, so the growth is real, not just top-line.
- Elite returns, low risk — a Return on Equity (ROE) near 52% with almost no debt is exceptional. The company funds itself and still pays a ~3.2% dividend.
- Not expensive — at a P/E ratio of roughly 14, the stock trades below its own historical average. On fundamentals alone, this looks like quality at a fair price.
Step 2 — The price chart
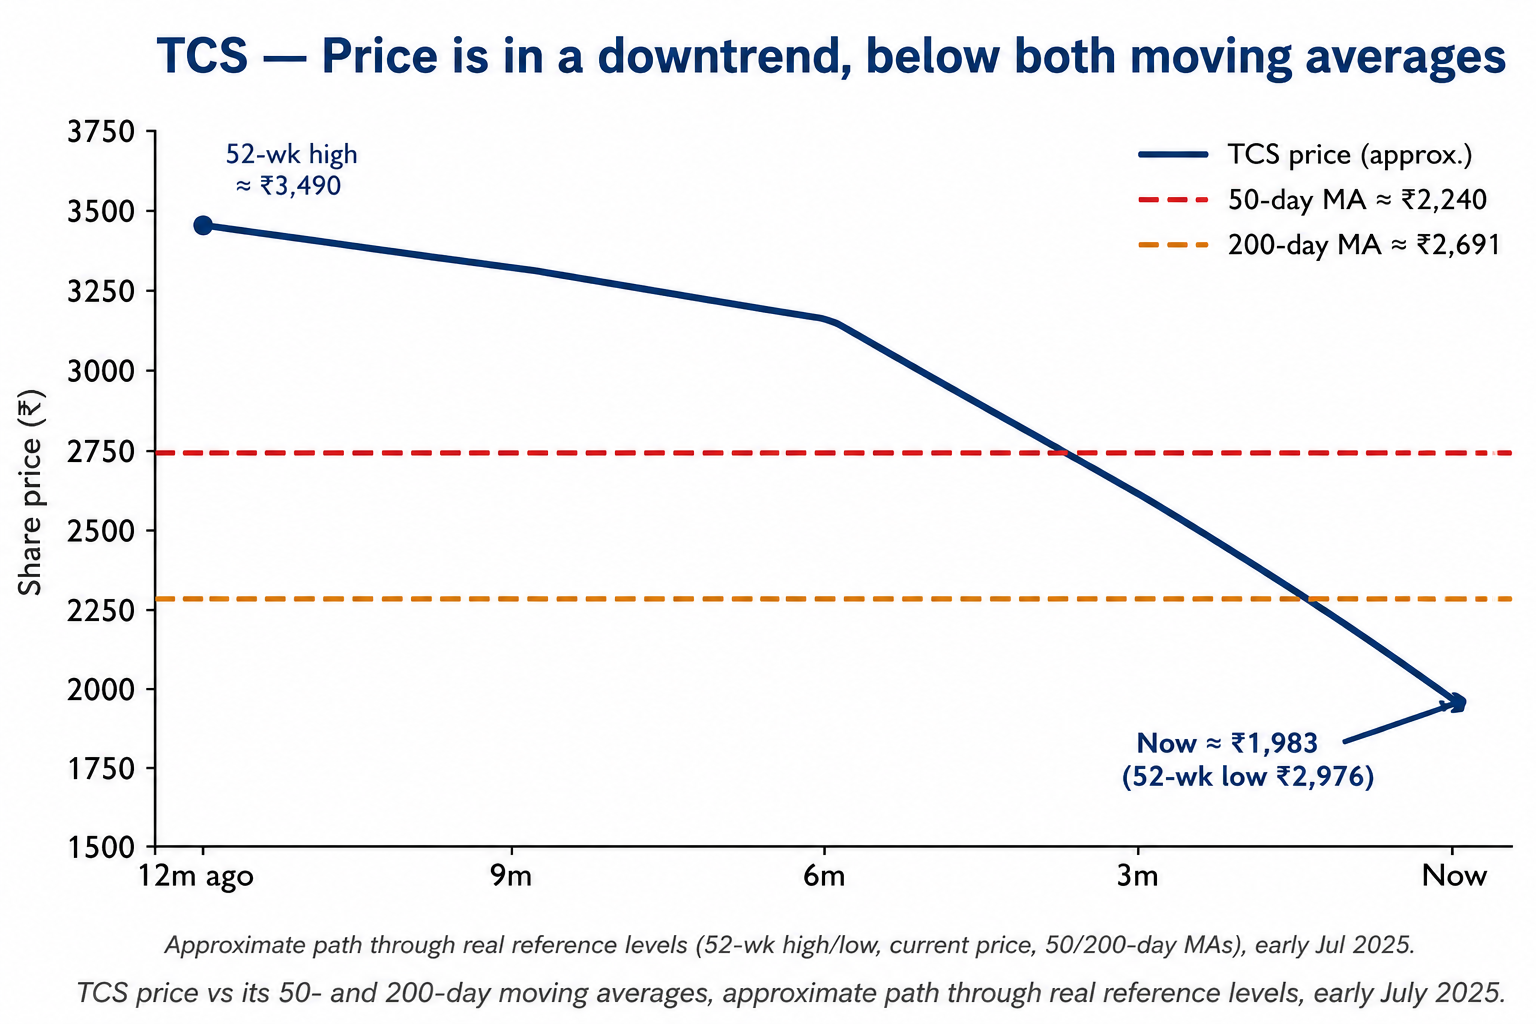
TCS price vs its 50- and 200-day moving averages, approximate path through real reference levels, early July 2026.
Now the twist. A strong business does not guarantee a rising share price — at least not in the short run:
- The stock is in a downtrend — TCS fell from a 52-week high near ₹3,490 to about ₹1,983, roughly a 40% decline over the year.
- It trades below both moving averages — sitting under the 50-day (≈₹2,240) and 200-day (≈₹2,691) lines is a classic bearish technical signal.
- Fundamentals and technicals disagree — the business is thriving, but the market's mood on the stock is negative right now.
The lesson: use both lenses
This is exactly why the pros combine the two. Fundamentals tell you whether a company is worth owning; technicals help you judge when the market agrees. Here is the same stock seen through each lens.
| Lens | What it says about TCS | How to use it |
|---|---|---|
| Fundamental | Strong and improving — rising profit, high ROE, low debt, fair P/E | Decides WHAT is worth owning |
| Technical | Weak right now — downtrend, below key moving averages | Helps time WHEN to enter or wait |
Neither lens is “wrong” — they answer different questions. The point is to know which one you are asking before you act.
Common Mistakes to Avoid
Even good investors lose money when they fall into these traps. Learn them now so you can sidestep them later.
- Chasing tips and hype. By the time a stock is trending on social media, the easy gains are often gone.
- Ignoring debt. A "cheap" stock with crushing debt is rarely a bargain.
- Falling for a low P/E blindly. A low price can signal a troubled business, not a discount.
- Overtrading. Constant buying and selling eats into returns through costs and taxes.
- No margin of safety. Always leave room for error — never assume the best case will happen.
- Emotional investing. Fear and greed cause more losses than any bad ratio ever will.
- No exit plan. Know in advance why you would sell, not just why you are buying.
A simple rule to remember: protect your capital first, grow it second.
Getting Expert Guidance: Hariprasad K, SEBI Registered Research Analyst
Learning fundamental analysis takes time, and the market rarely gives beginners a smooth ride. This is where working with a qualified professional makes a real difference.
Hariprasad K is a SEBI Registered Research Analyst (RA) — which means the research and market guidance provided follow the standards and compliance framework set by the Securities and Exchange Board of India.
Choosing a SEBI-registered analyst matters because:
- The analyst operates within a regulated, accountable framework.
- Research is backed by process and disclosure, not just opinion.
- You get structured guidance on analysis, risk, and decision-making rather than random tips.
Whether you are trying to read your first balance sheet or refine your stock-picking process, guidance from a registered professional can help you build confidence and avoid costly beginner errors.
Conclusion
Picking winning stocks is a skill, and like any skill, it improves with practice and a clear process.
Let's recap the core steps:
- Read the balance sheet to judge financial health.
- Analyse quarterly results to track momentum.
- Use simple, proven strategies built for beginners.
- Screen stocks to focus your research.
- Avoid the common mistakes that trap most people.
You do not need to be a genius to invest well. You need a repeatable checklist, patience, and the discipline to stick to your rules — even when the market gets noisy.
Start small, stay consistent, and let the fundamentals guide you.
???? Ready to Take the Next Step?
Don't leave your investments to guesswork. If you want structured, research-backed guidance from a SEBI Registered Research Analyst, connect with Hariprasad K today and start making smarter, more confident stock decisions.
Reach out now and turn your fundamental analysis knowledge into real results.
FAQ:
- What is the difference between fundamental analysis and technical analysis?
Fundamental analysis studies a company's financial health and business value to decide what to buy for the long term. Technical analysis studies price charts and patterns to decide when to buy or sell. Many investors use both together.
- How long does it take to learn fundamental analysis?
You can learn the basics — reading a balance sheet and quarterly results — in a few weeks. Becoming confident takes months of consistent practice on real companies. The key is to start small and stay consistent.
- Which financial ratio is most important for beginners?
There is no single “best” ratio, but Return on Equity (ROE), Debt-to-Equity, and the P/E ratio are excellent starting points. Always read them together, never in isolation.
- Can I pick winning stocks without a stock screener?
Yes, but a screener saves enormous time by narrowing thousands of stocks to a manageable shortlist. Beginners should use a screener to filter candidates, then research each one manually before investing.
- Is fundamental analysis useful for short-term trading?
Fundamental analysis is most powerful for medium- to long-term investing. For very short-term trades, price action and technical analysis play a bigger role. That said, knowing a company's fundamentals still helps you avoid weak businesses.